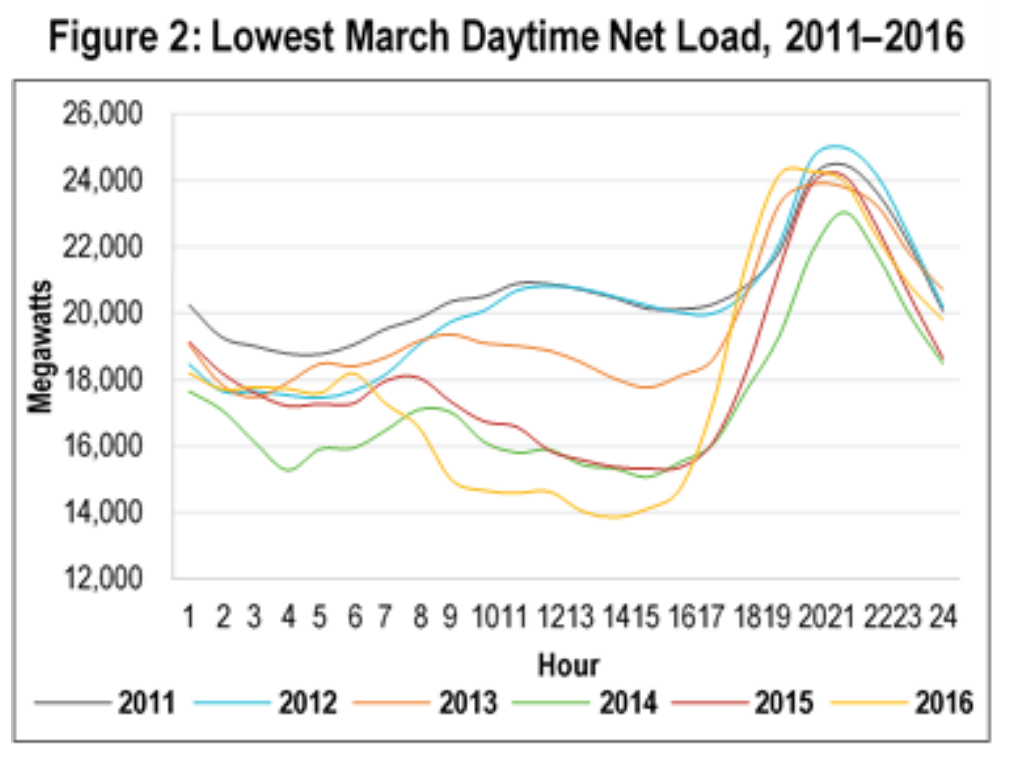
The duck curve is the product of a 2013 analysis of projected electric load for 2012 through 2020 undertaken by the California ISO to better understand how increasing renewable resource penetration would affect the grid. The analysis examined net load, which is the load served by the electric system minus the load served by variable generation.
CAISO’s analysis found that in certain times of the year net load drops during mid-day and quickly ramps up to a late-day peak, and that the steepness of that curve would become more severe each year, resulting in a growing gap that would need to be filled by generation that can ramp up quickly.
In its report, ScottMadden compared the original CAISO forecasts to detailed, actual operational data, and conclude that “the duck curve is real and growing faster than expected.”
